The Problem & Motivation:
The model organism Tetrahymena thermophila is foundational to biological discoveries but is difficult to study with high-throughput genetic screens. While a wealth of transcriptomic data (both legacy microarray and modern RNA-seq) exists, it remained fragmented in unconnected datasets. This project was motivated by the need to unify these disparate data types under a single, robust bioinformatic pipeline to make functional gene discovery more accessible to researchers.
Key Features:
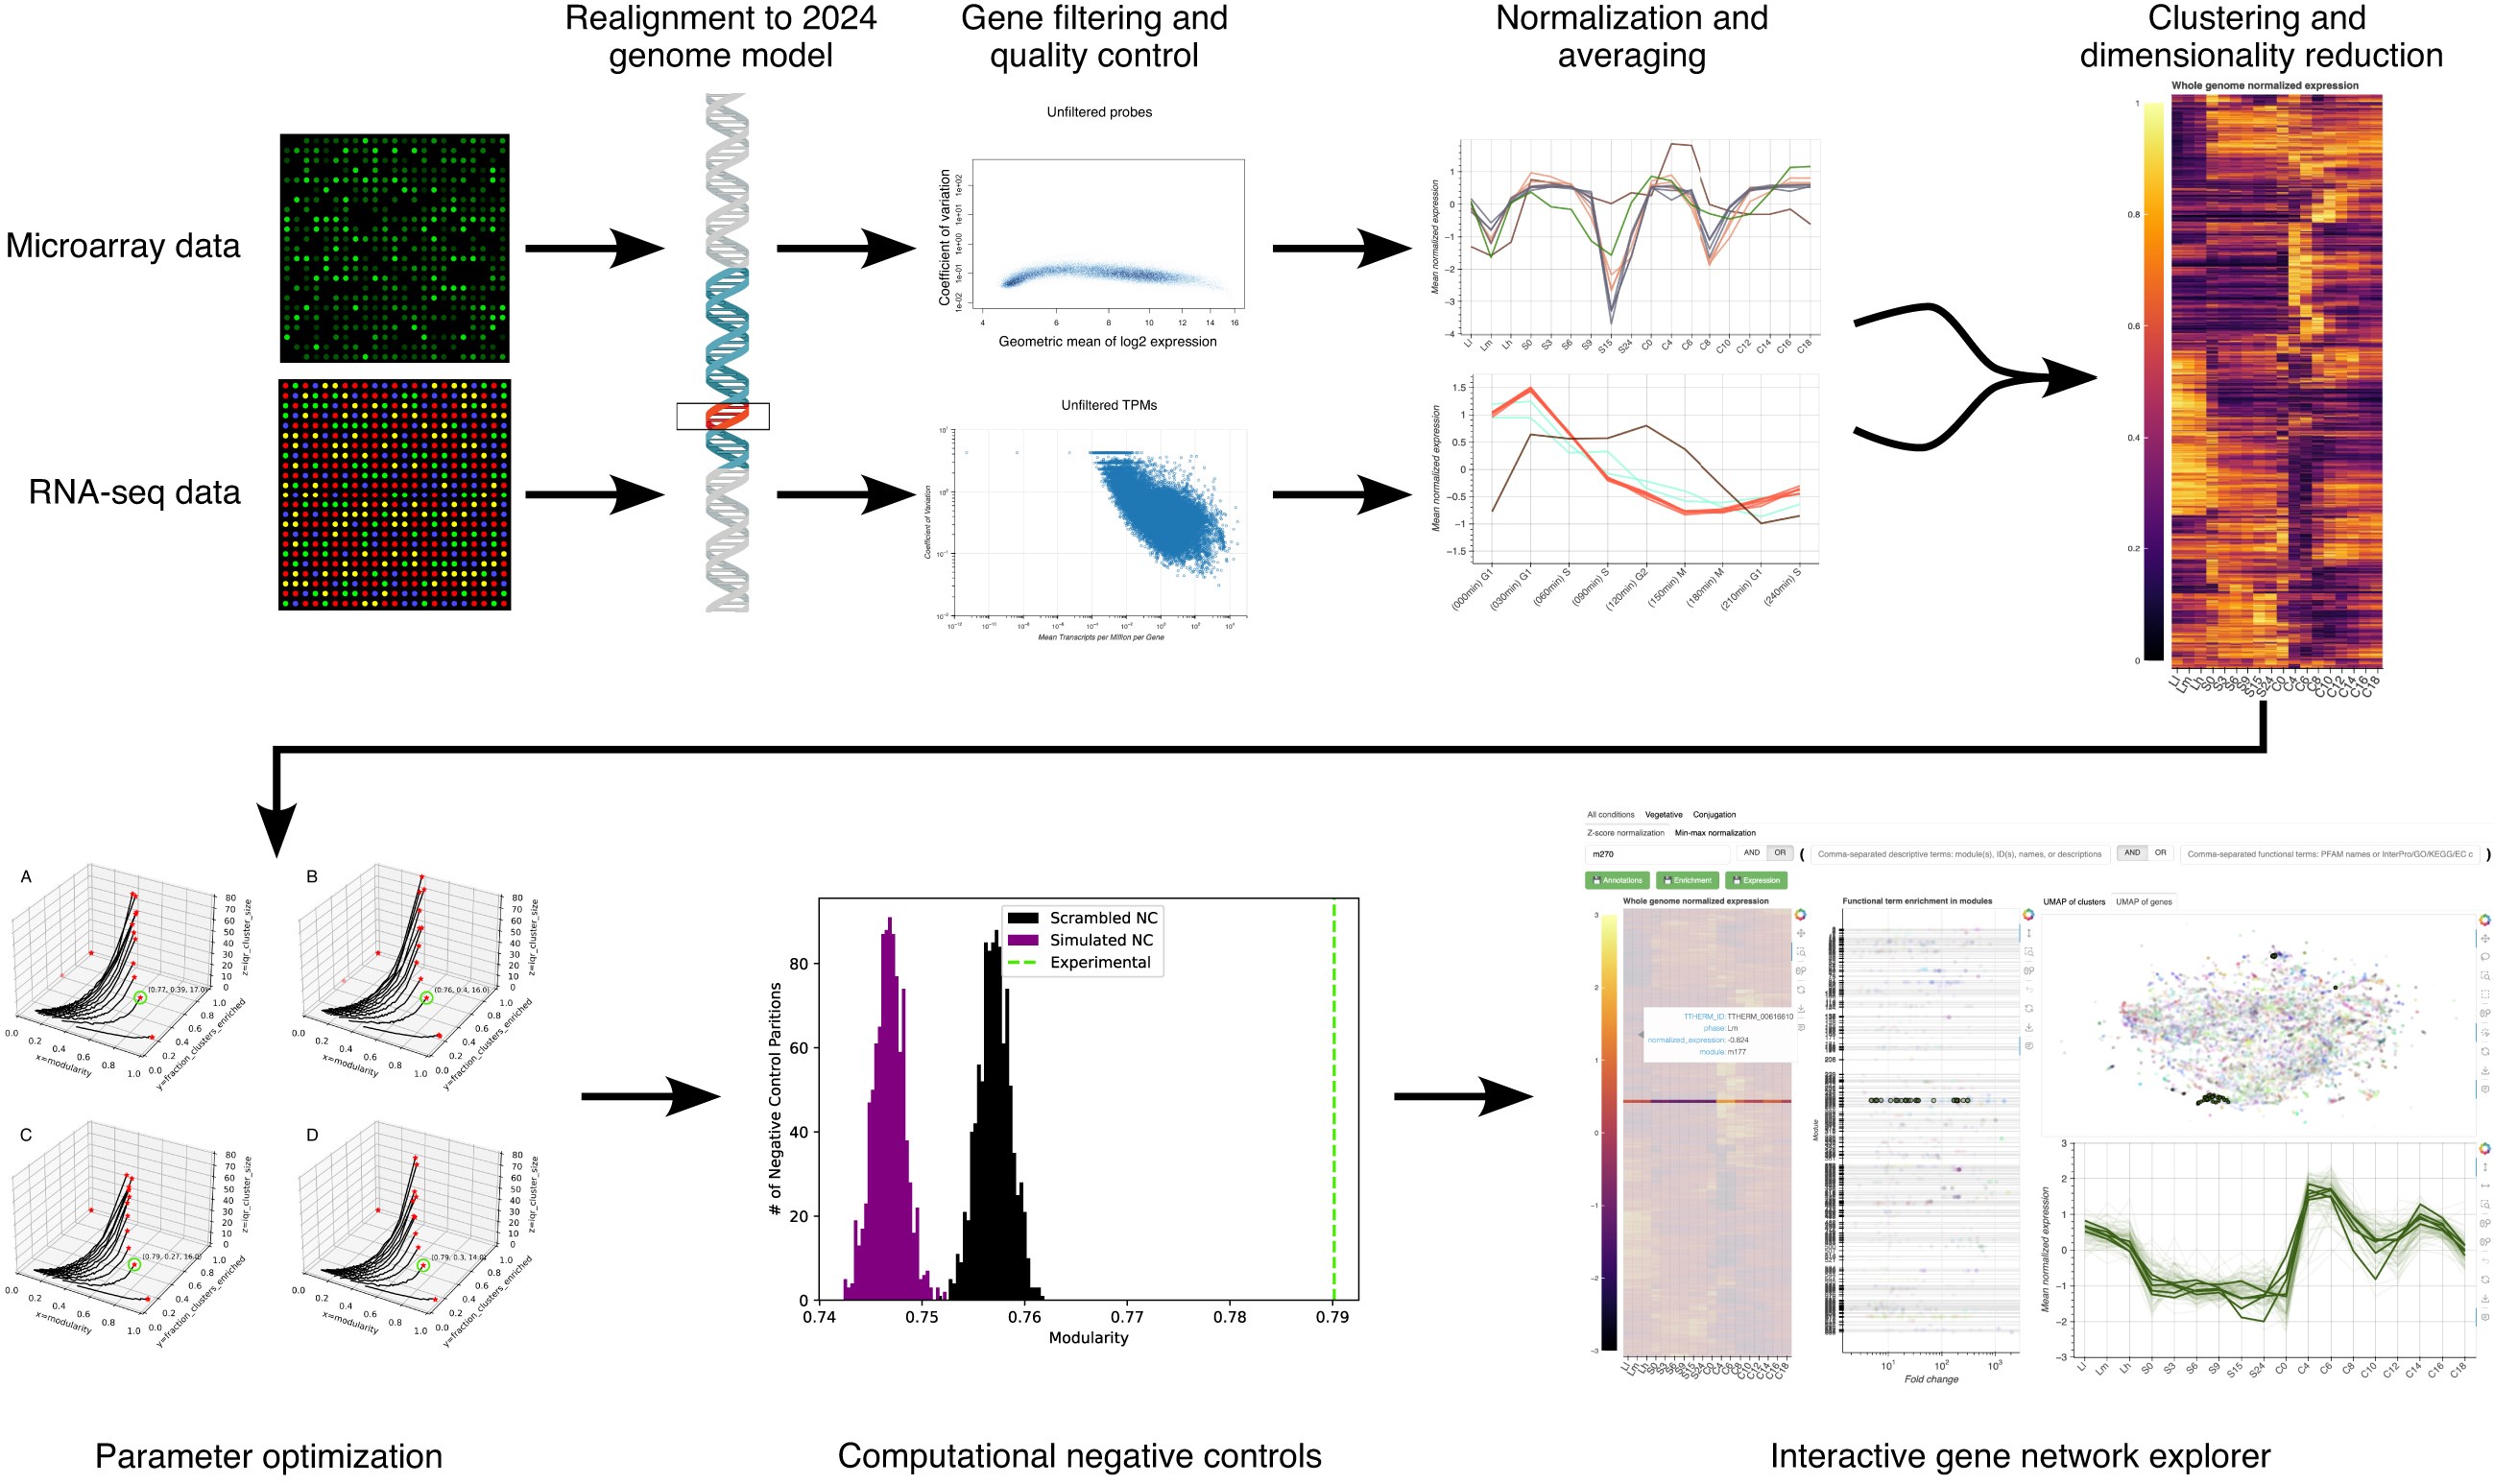
Data Integration Pipeline: Implements a rigorous pipeline to process, perform quality control (RMA normalization, NUSE, batch effect removal), filter, and normalize disparate microarray and RNA-seq datasets into a common analytical framework.
Validated Co-Expression Clustering: Uses a Pareto-optimized parameter scan (testing distance metrics, nearest neighbors) to build a high-dimensional graph (UMAP) which is then partitioned using the Leiden community detection algorithm to identify statistically significant co-expression modules.
Interactive HTML Dashboard (TGNE): A standalone, maintenance-free web application that allows researchers to search for genes, visualize expression heatmaps, explore UMAP embeddings, and analyze functional enrichment (GO, KEGG) for any gene cluster.
Hypothesis Validation: The methodology was successfully validated by recovering over 80% of previously known genes involved in mucocyst biogenesis and experimentally confirming that four newly identified, co-expressed genes are involved in the pathway.
My Contributions:
As a lead developer on this project, my responsibilities covered the entire pipeline except for the initial microarray data processing. This included:
- Developing and implementing the RNA-seq quantification pipeline using kallisto.
- Designing and executing the core co-expression clustering methodology, including the Pareto-optimized parameter scan, UMAP graph construction, and Leiden community detection.
- Building the interactive Bokeh dashboard (TGNE) from the ground up for data visualization and hypothesis generation.
- Conducting the computational validation, including the implementation of scrambled and simulated negative controls to verify the statistical significance of our clusters.
Tech Stack & Implementation:
Data Processing & Normalization: kallisto for RNA-seq transcript quantification. The legacy microarray pipeline was handled by collaborators using R (oligo, limma).
Clustering & Analysis: Python with pandas and numpy for data manipulation. scikit-learn and scipy were used for distance matrix calculations and statistical controls.
Network & Community Detection: Graphs were constructed using umap-learn and clustered using the leidenalg library. Parameter optimization was guided by networkx modularity scores.
Visualization & Dashboard: Bokeh was used to generate all plots and the final interactive, standalone HTML dashboard.
Resources & Citation
Michael A. Bertagna, Lydia J. Bright, Fei Ye, Yu-Yang Jiang, Debolina Sarkar, Ajay Pradhan, Santosh Kumar, Shan Gao, Aaron P. Turkewitz, Lev M. Z. Tsypin, “Inferring gene-pathway associations from consolidated transcriptome datasets: an interactive gene network explorer for Tetrahymena thermophila,” NAR Genomics and Bioinformatics, Volume 7, Issue 2, June 2025, lqaf067. doi:10.1093/nargab/lqaf067